
500mb Maps on hodo.graphics
Mid and upper-level maps are crucial in understanding synoptic scale weather patterns and predicting severe weather.
hodo.graphics provides 500mb forecast maps from different models to aid in synoptic scale forecasting. 500 mb maps are crucial for severe weather forecasting, primarily via the identification of troughs and their geometry. hodo.graphics has two different views at 500mb: a traditional view including geopotential height, wind barbs and a speed gradient, and a hodo.graphics-unique view including the same geopotential data and wind barbs but additionally surface dew points to help identify trough and moisture coincidence.
Geopotential Height & Winds
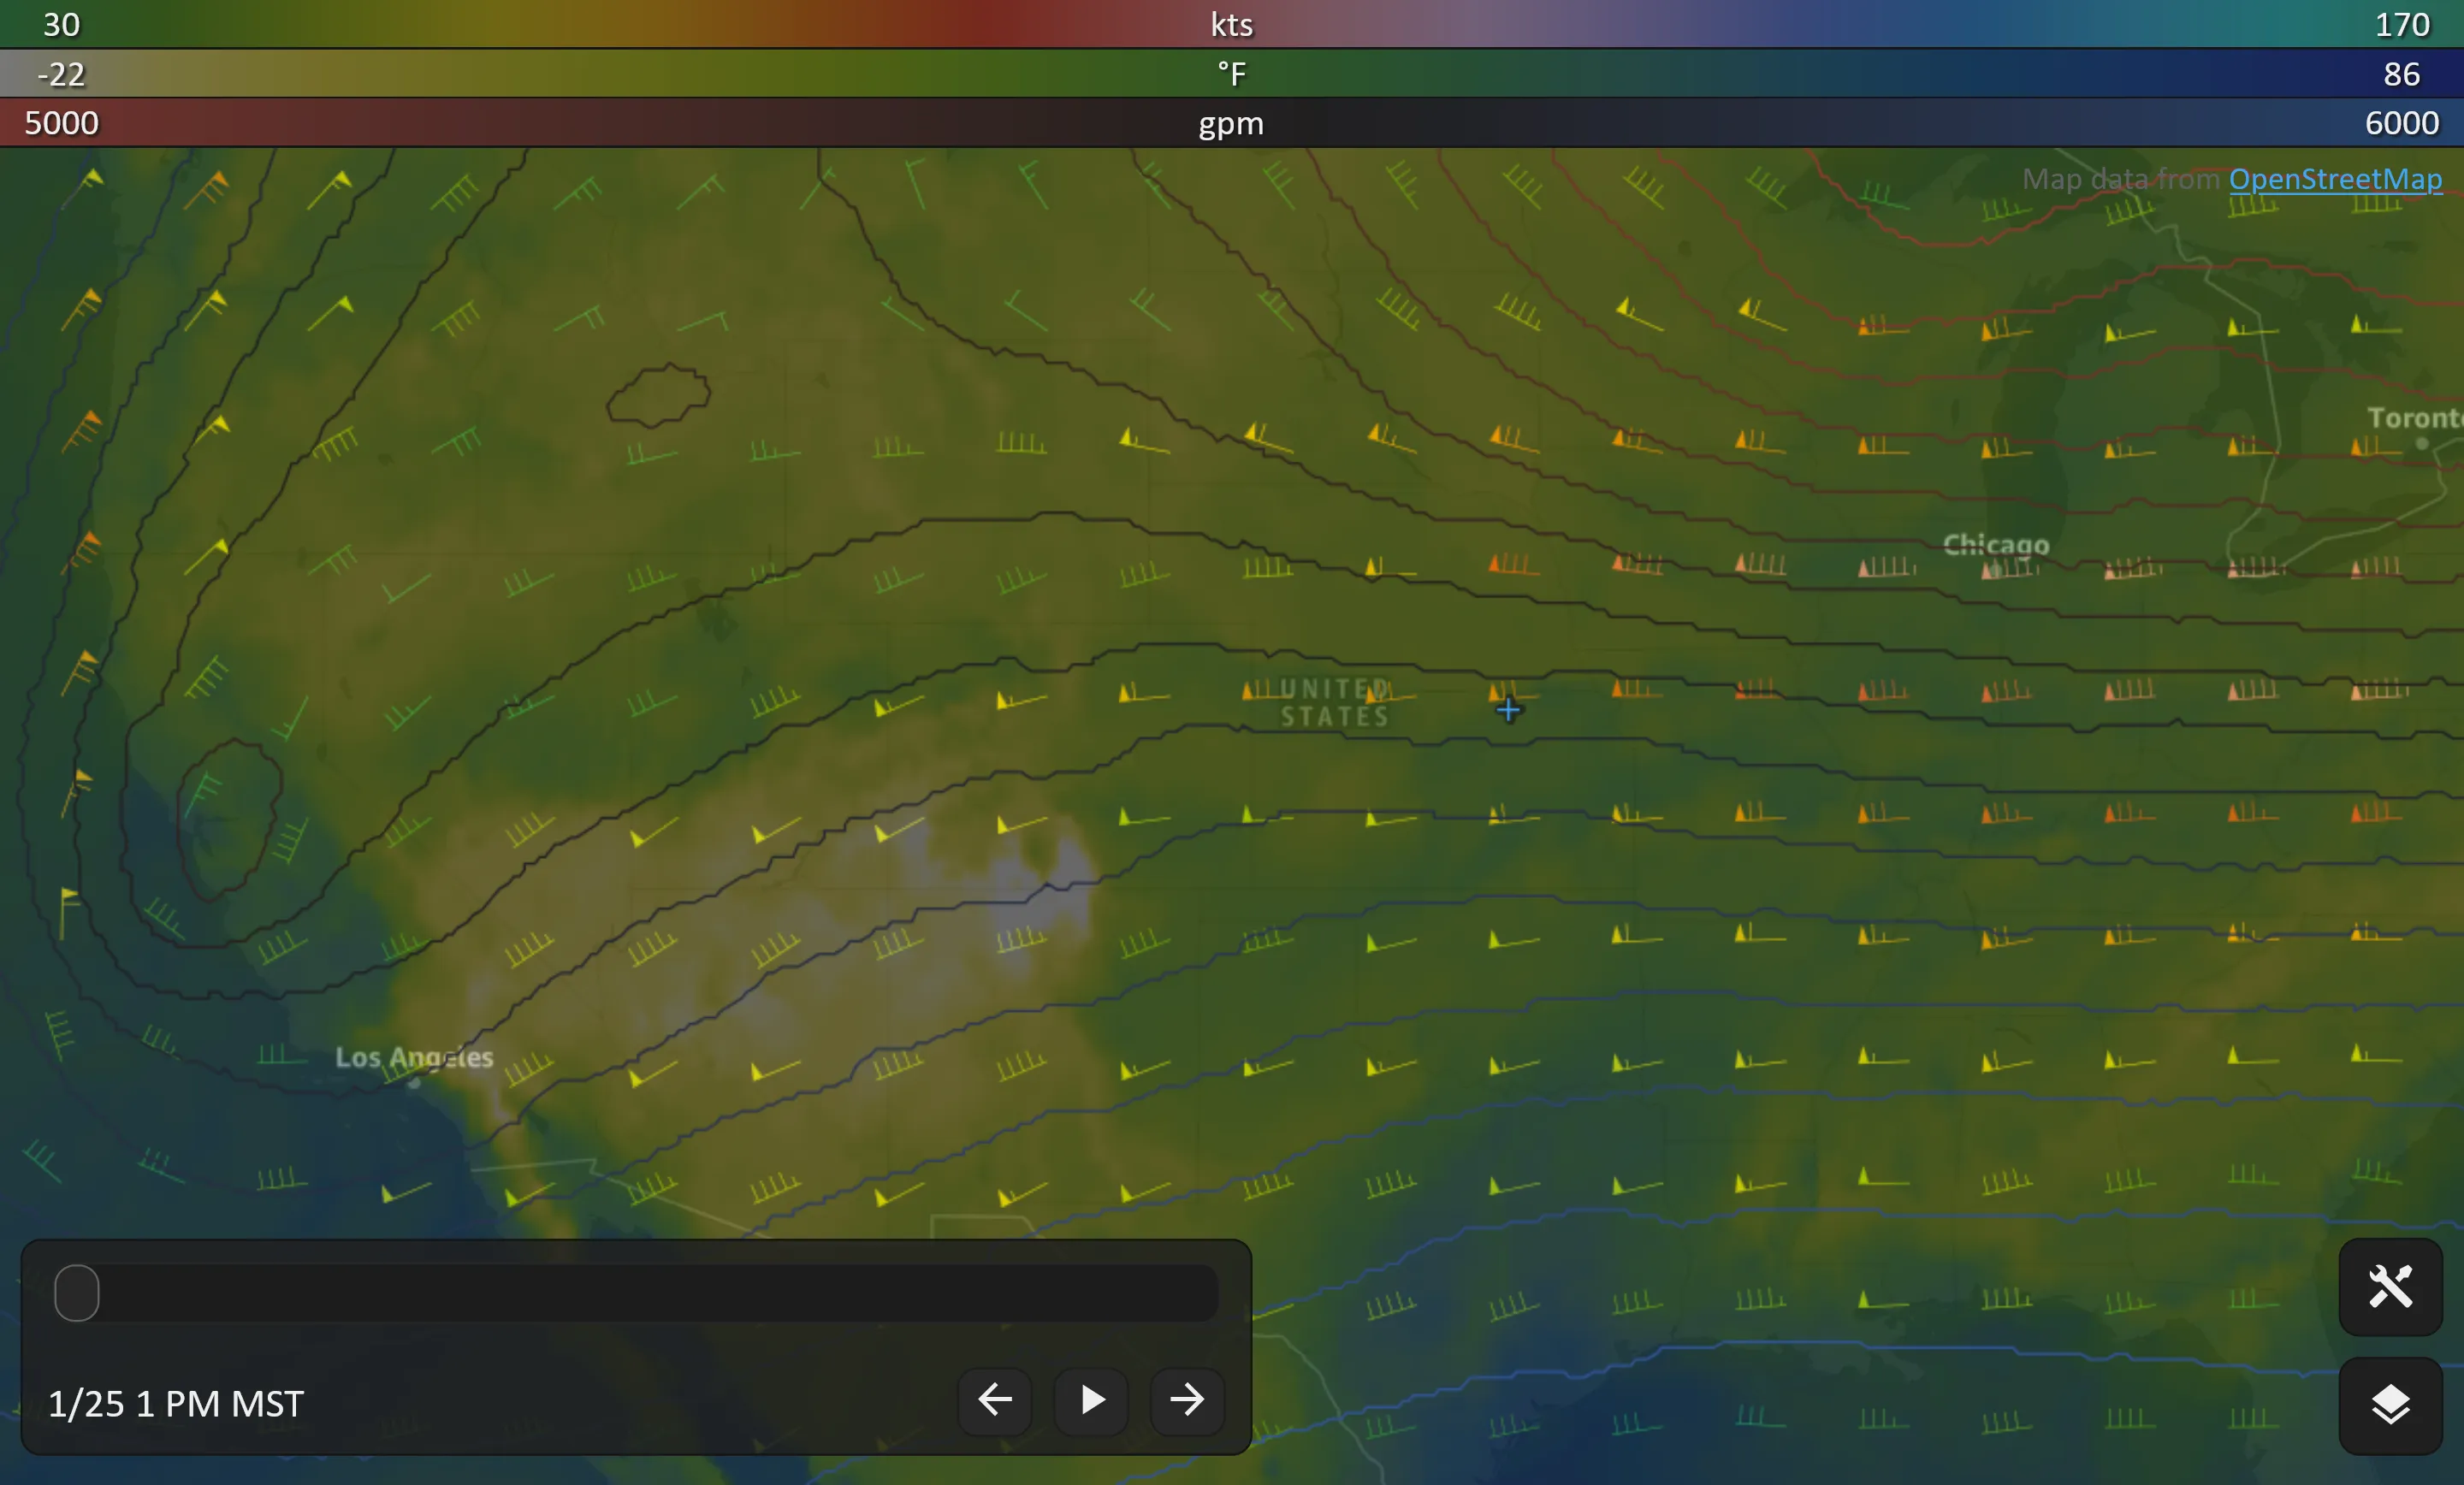
The primary feature of the 500mb map is the display of the geopotential height at a pressure-level of 500 millibars. This pressure level typically corresponds to an altitude between 16,000 feet and 20,000 feet elevation and provides insight into the large-scale behavior of the atmosphere. Geopotential height refers to the elevation at which the atmosphere reaches a given pressure. Contour lines represent a contstant pressure surface, much like a topographic map, except instead of showing terrain, they deptic the height for some pressure.
In addition to geopotential height, these maps generally show winds at 500mb, which often correlate with the height contours. The direction and speed of these winds offer valuable information about atmospheric flow and dynamics.
Troughs
Troughs are easily identified on 500mb maps as "fingers" of low pressure extending from the poles towards the equator. In the Northern Hemisphere, these troughs typically originate in the Arctic and stretch into the mid-latitudes. Winds around these troughs rotate in a cyclonic manner (counterclockwise in the Northern Hemisphere). The term "trough" refers to the shape's resemblance to a physical depression, and on a constant pressure surface, these troughs appear as a "canyon" or valley-like formation.
When analyzing atmospheric behavior, it’s useful to divide a trough into an "entrance" and "exit" region. Imagine splitting the trough down its axis:
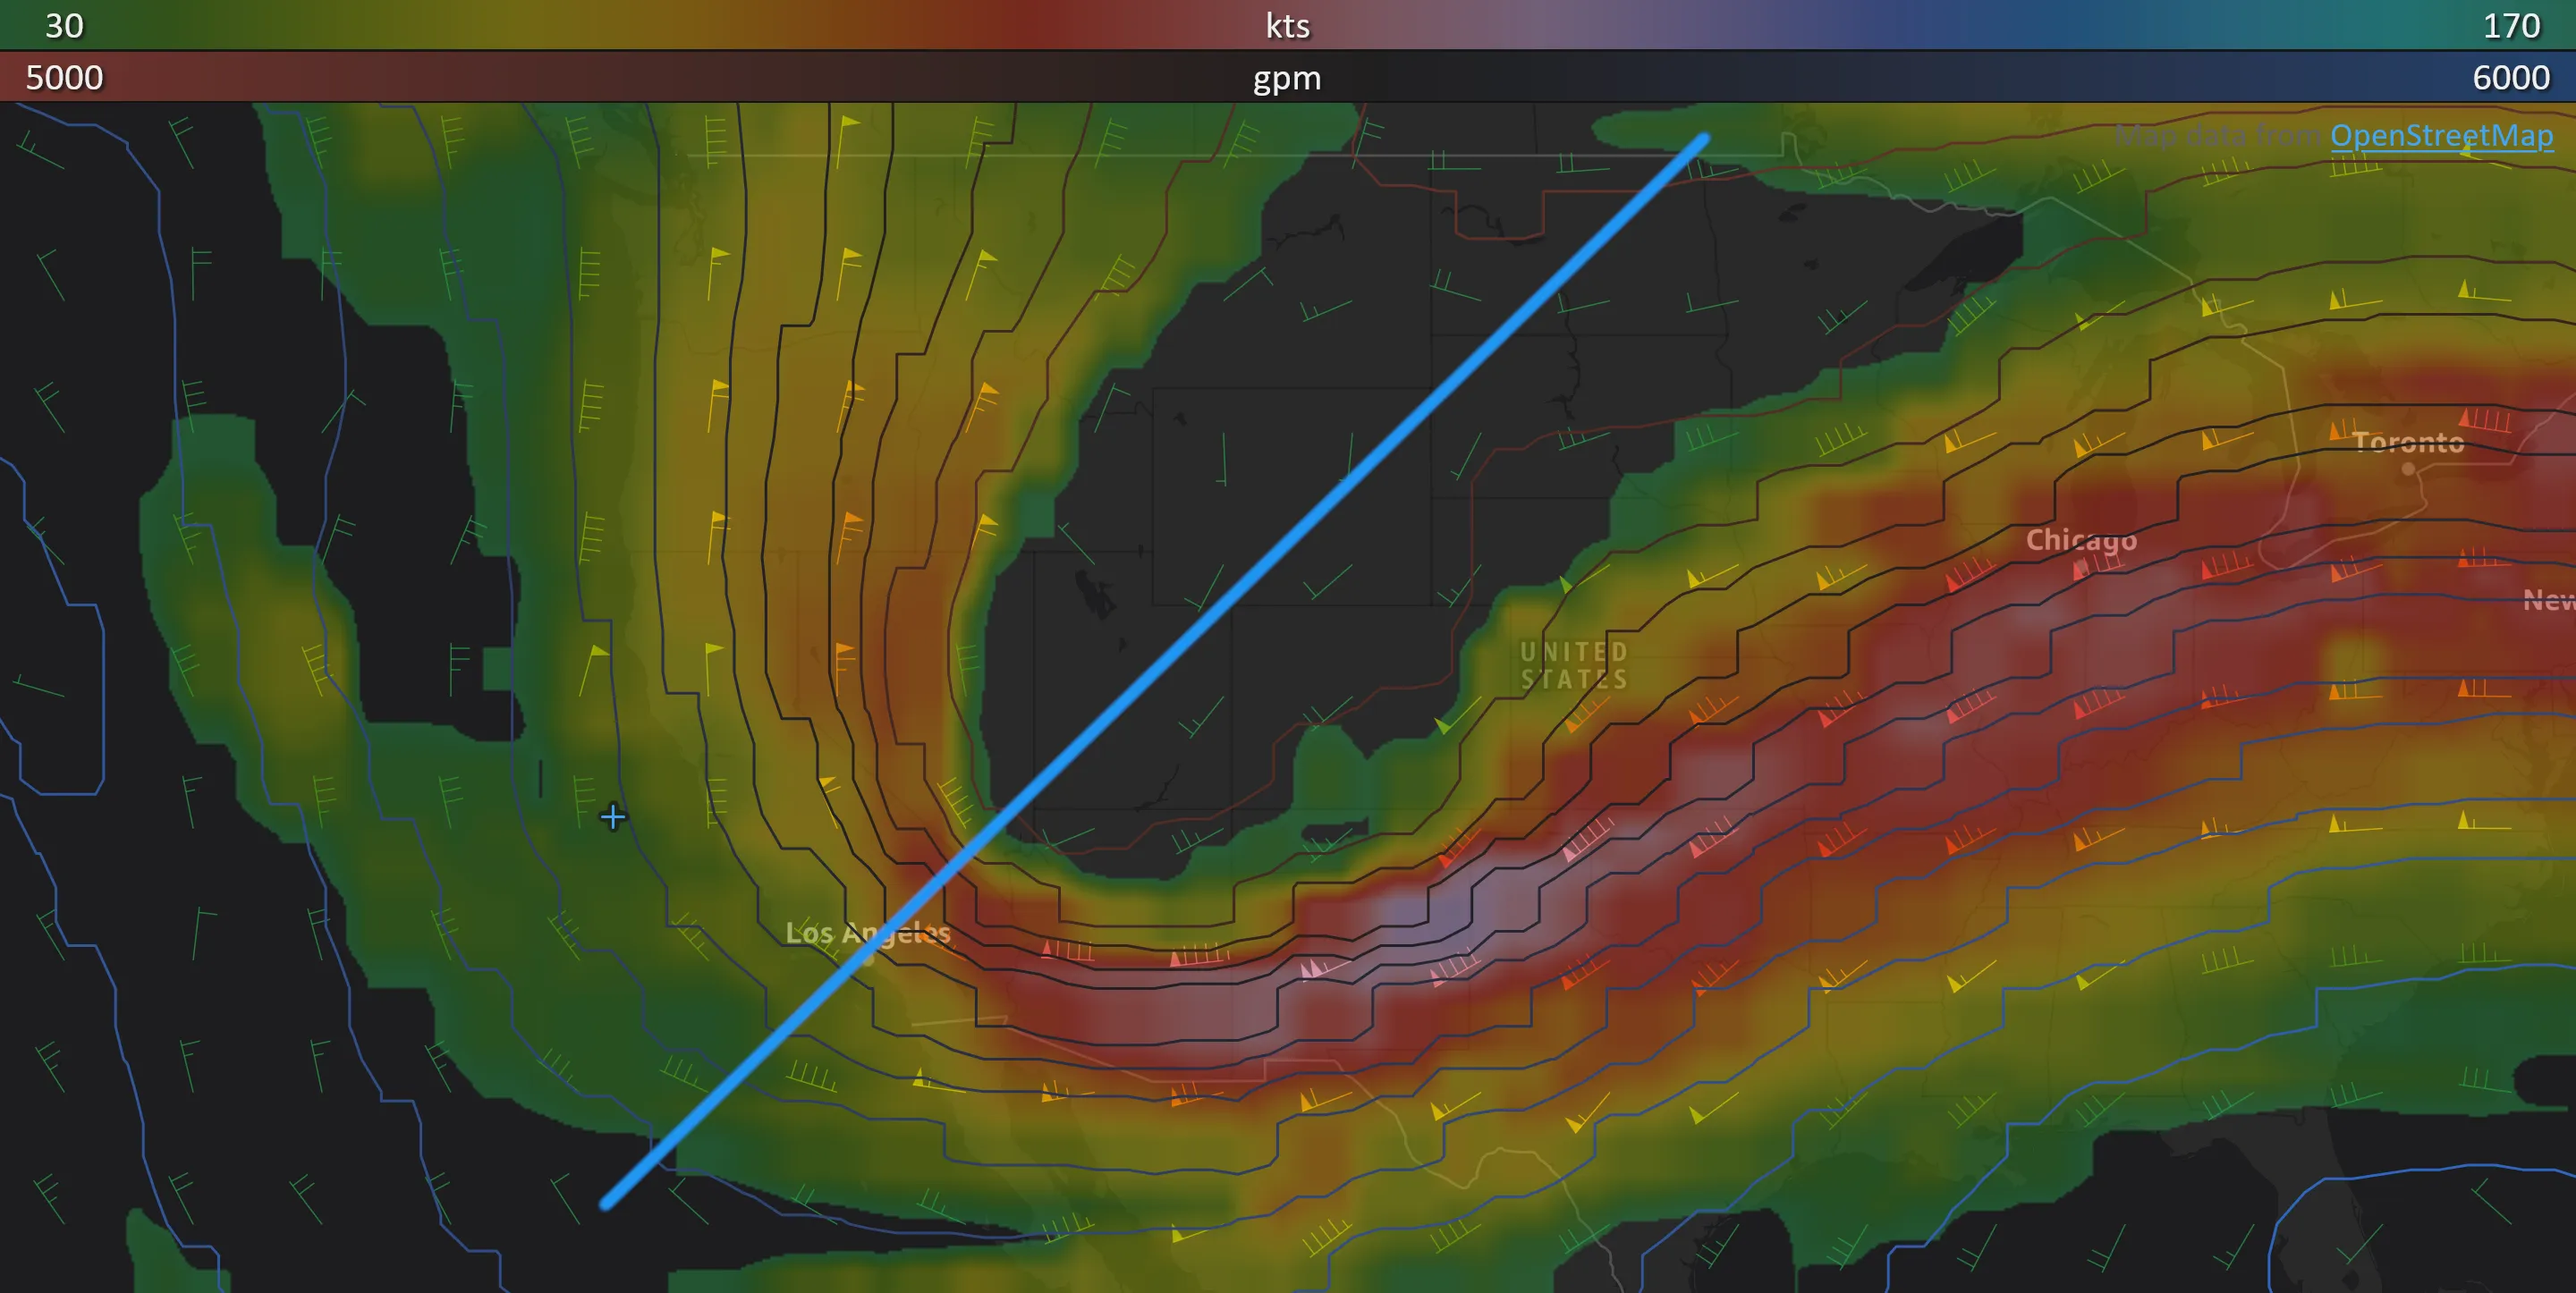
In the Northern Hemisphere, the western side of the trough is called the "entrance" region, while the eastern side is the "exit" region. Generally, winds in the entrance region tend to converge, while winds in the exit region diverge. These wind patterns play a critical role in the development of low-pressure systems.
Cyclogensis
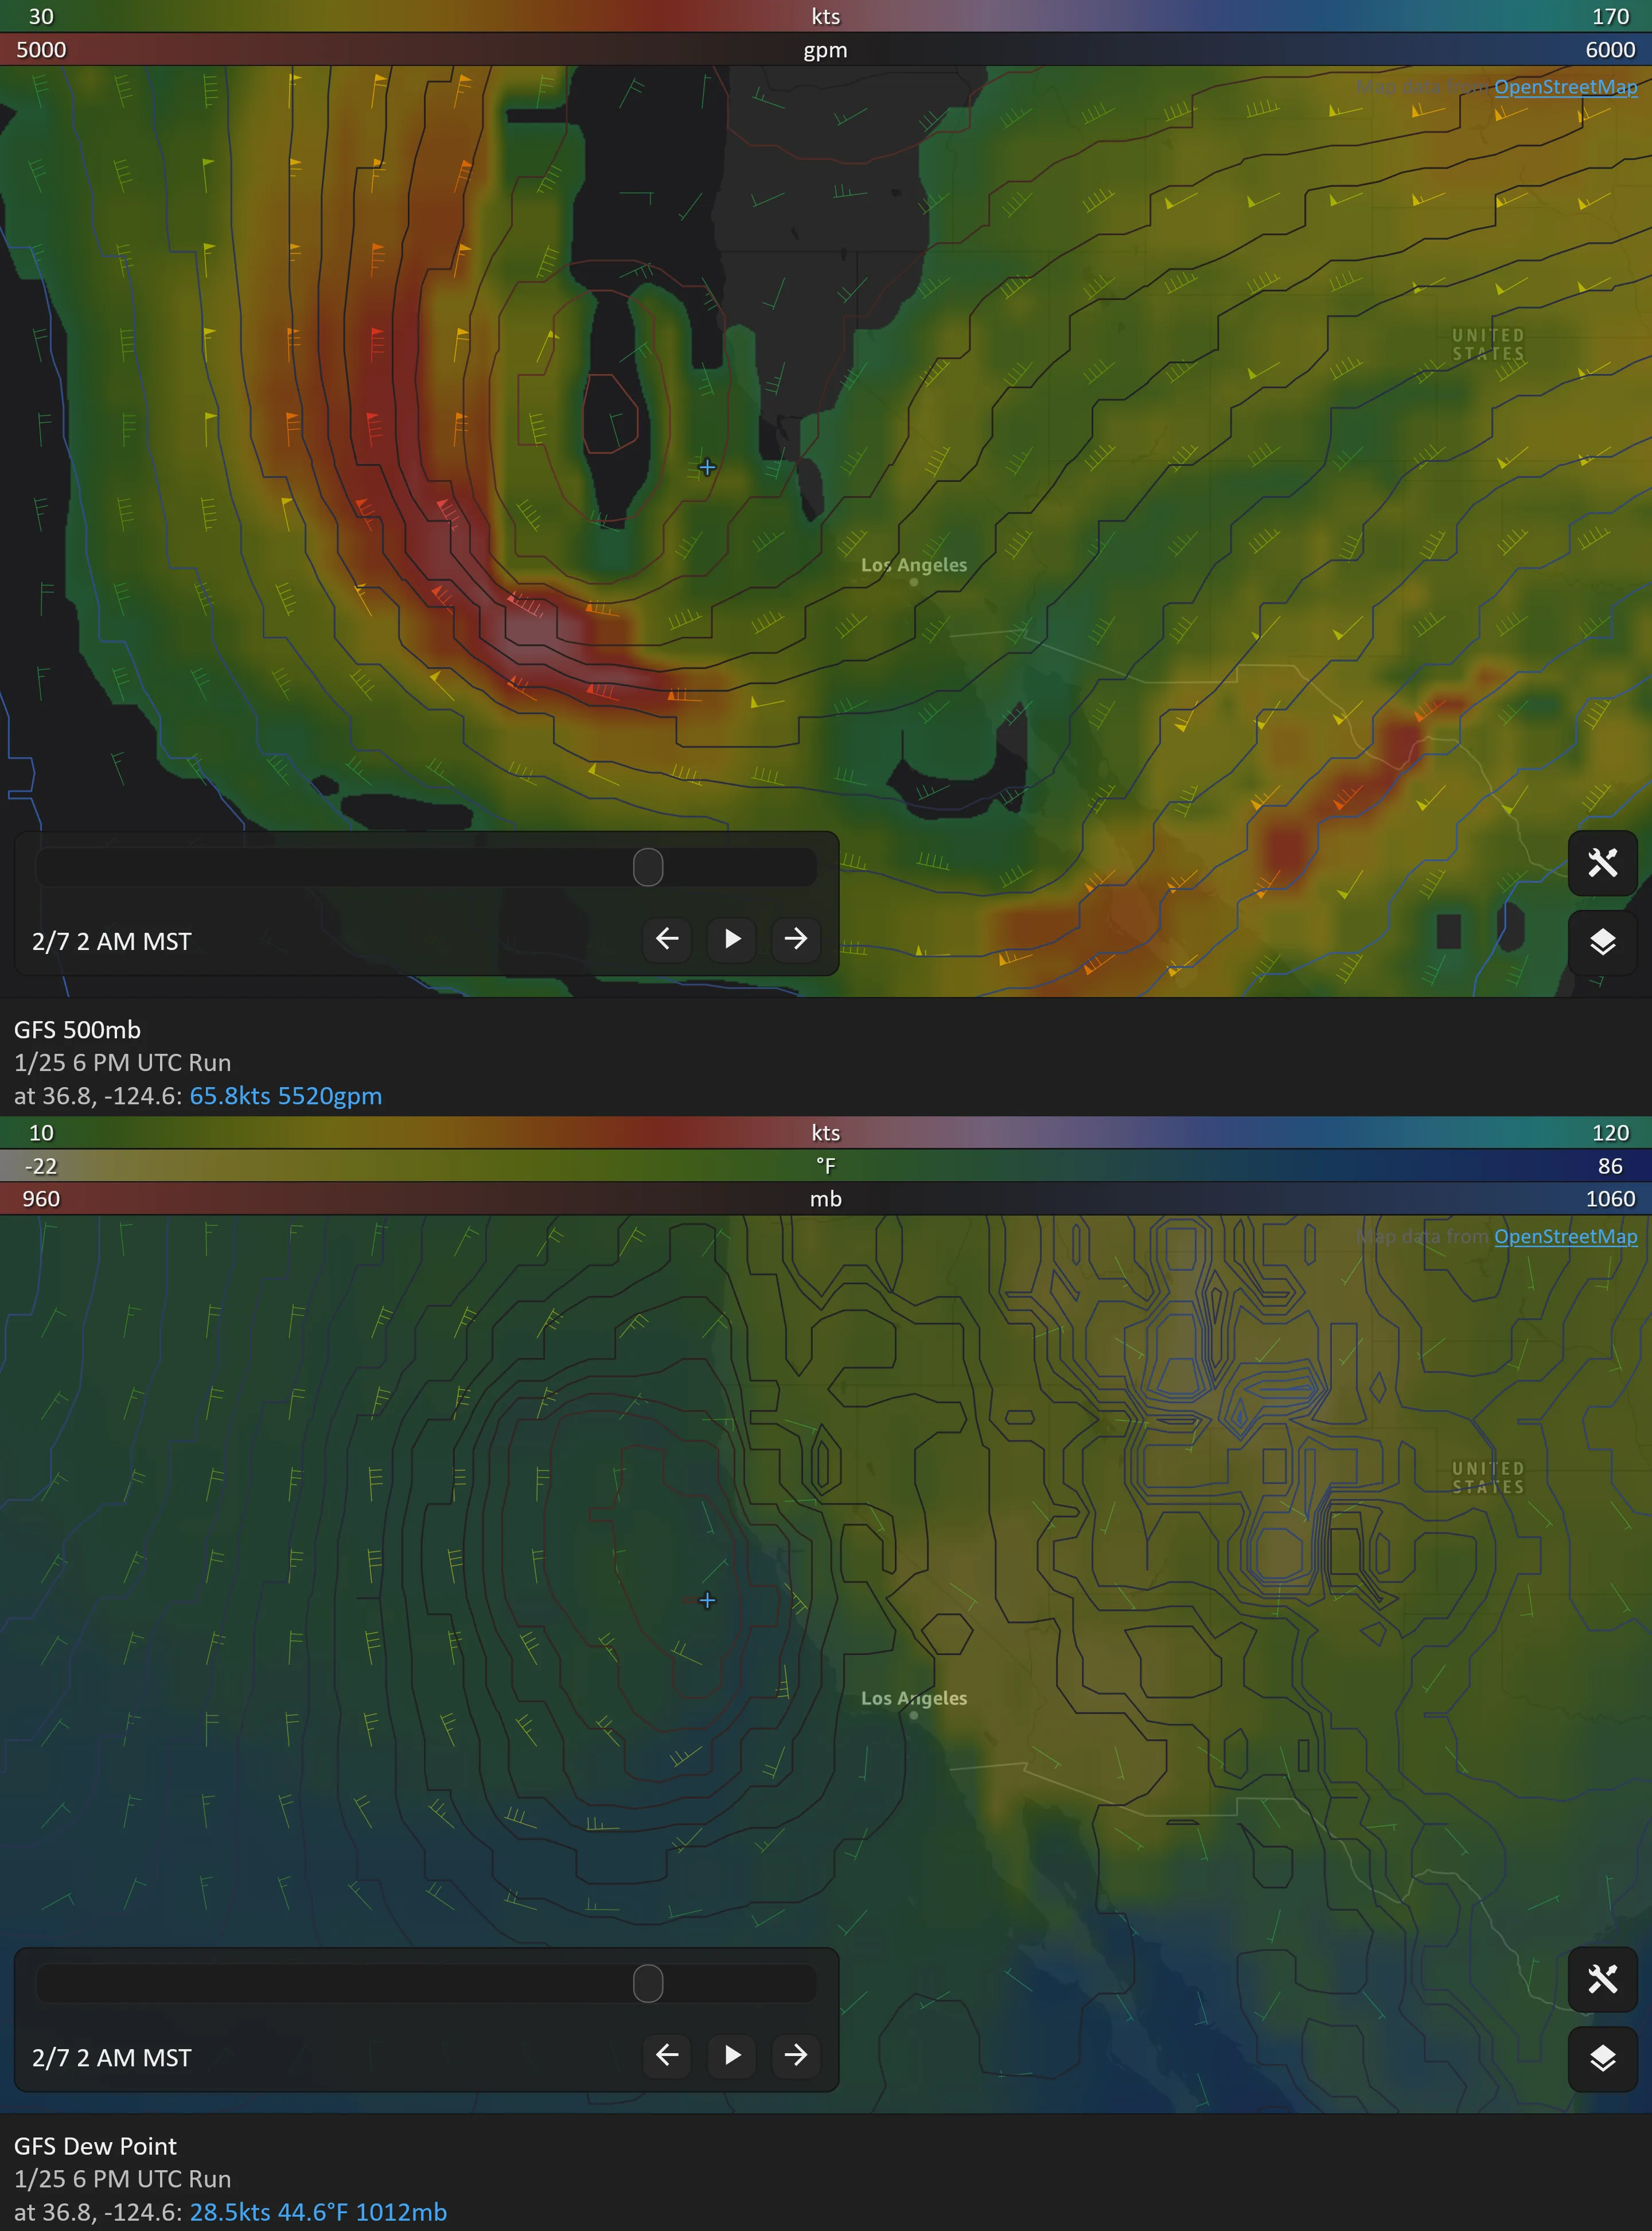
Divergence of winds in the mid and upper atmosphere leads to upward motion, as air attempts to fill the "void" created by the diverging winds. As mentioned earlier, the exit region of a trough is where wind divergence typically occurs, and this often results in the development of a surface low-pressure system, initiating cyclogenesis. If you examine the surface pressure and wind patterns in areas where strong mid or upper-level wind divergence is occurring near the exit region of a trough, you’ll often find a surface low with cyclonic winds circulating around it.
The image below shows a loose example of a trough and surface low colocated:
Moisture Return
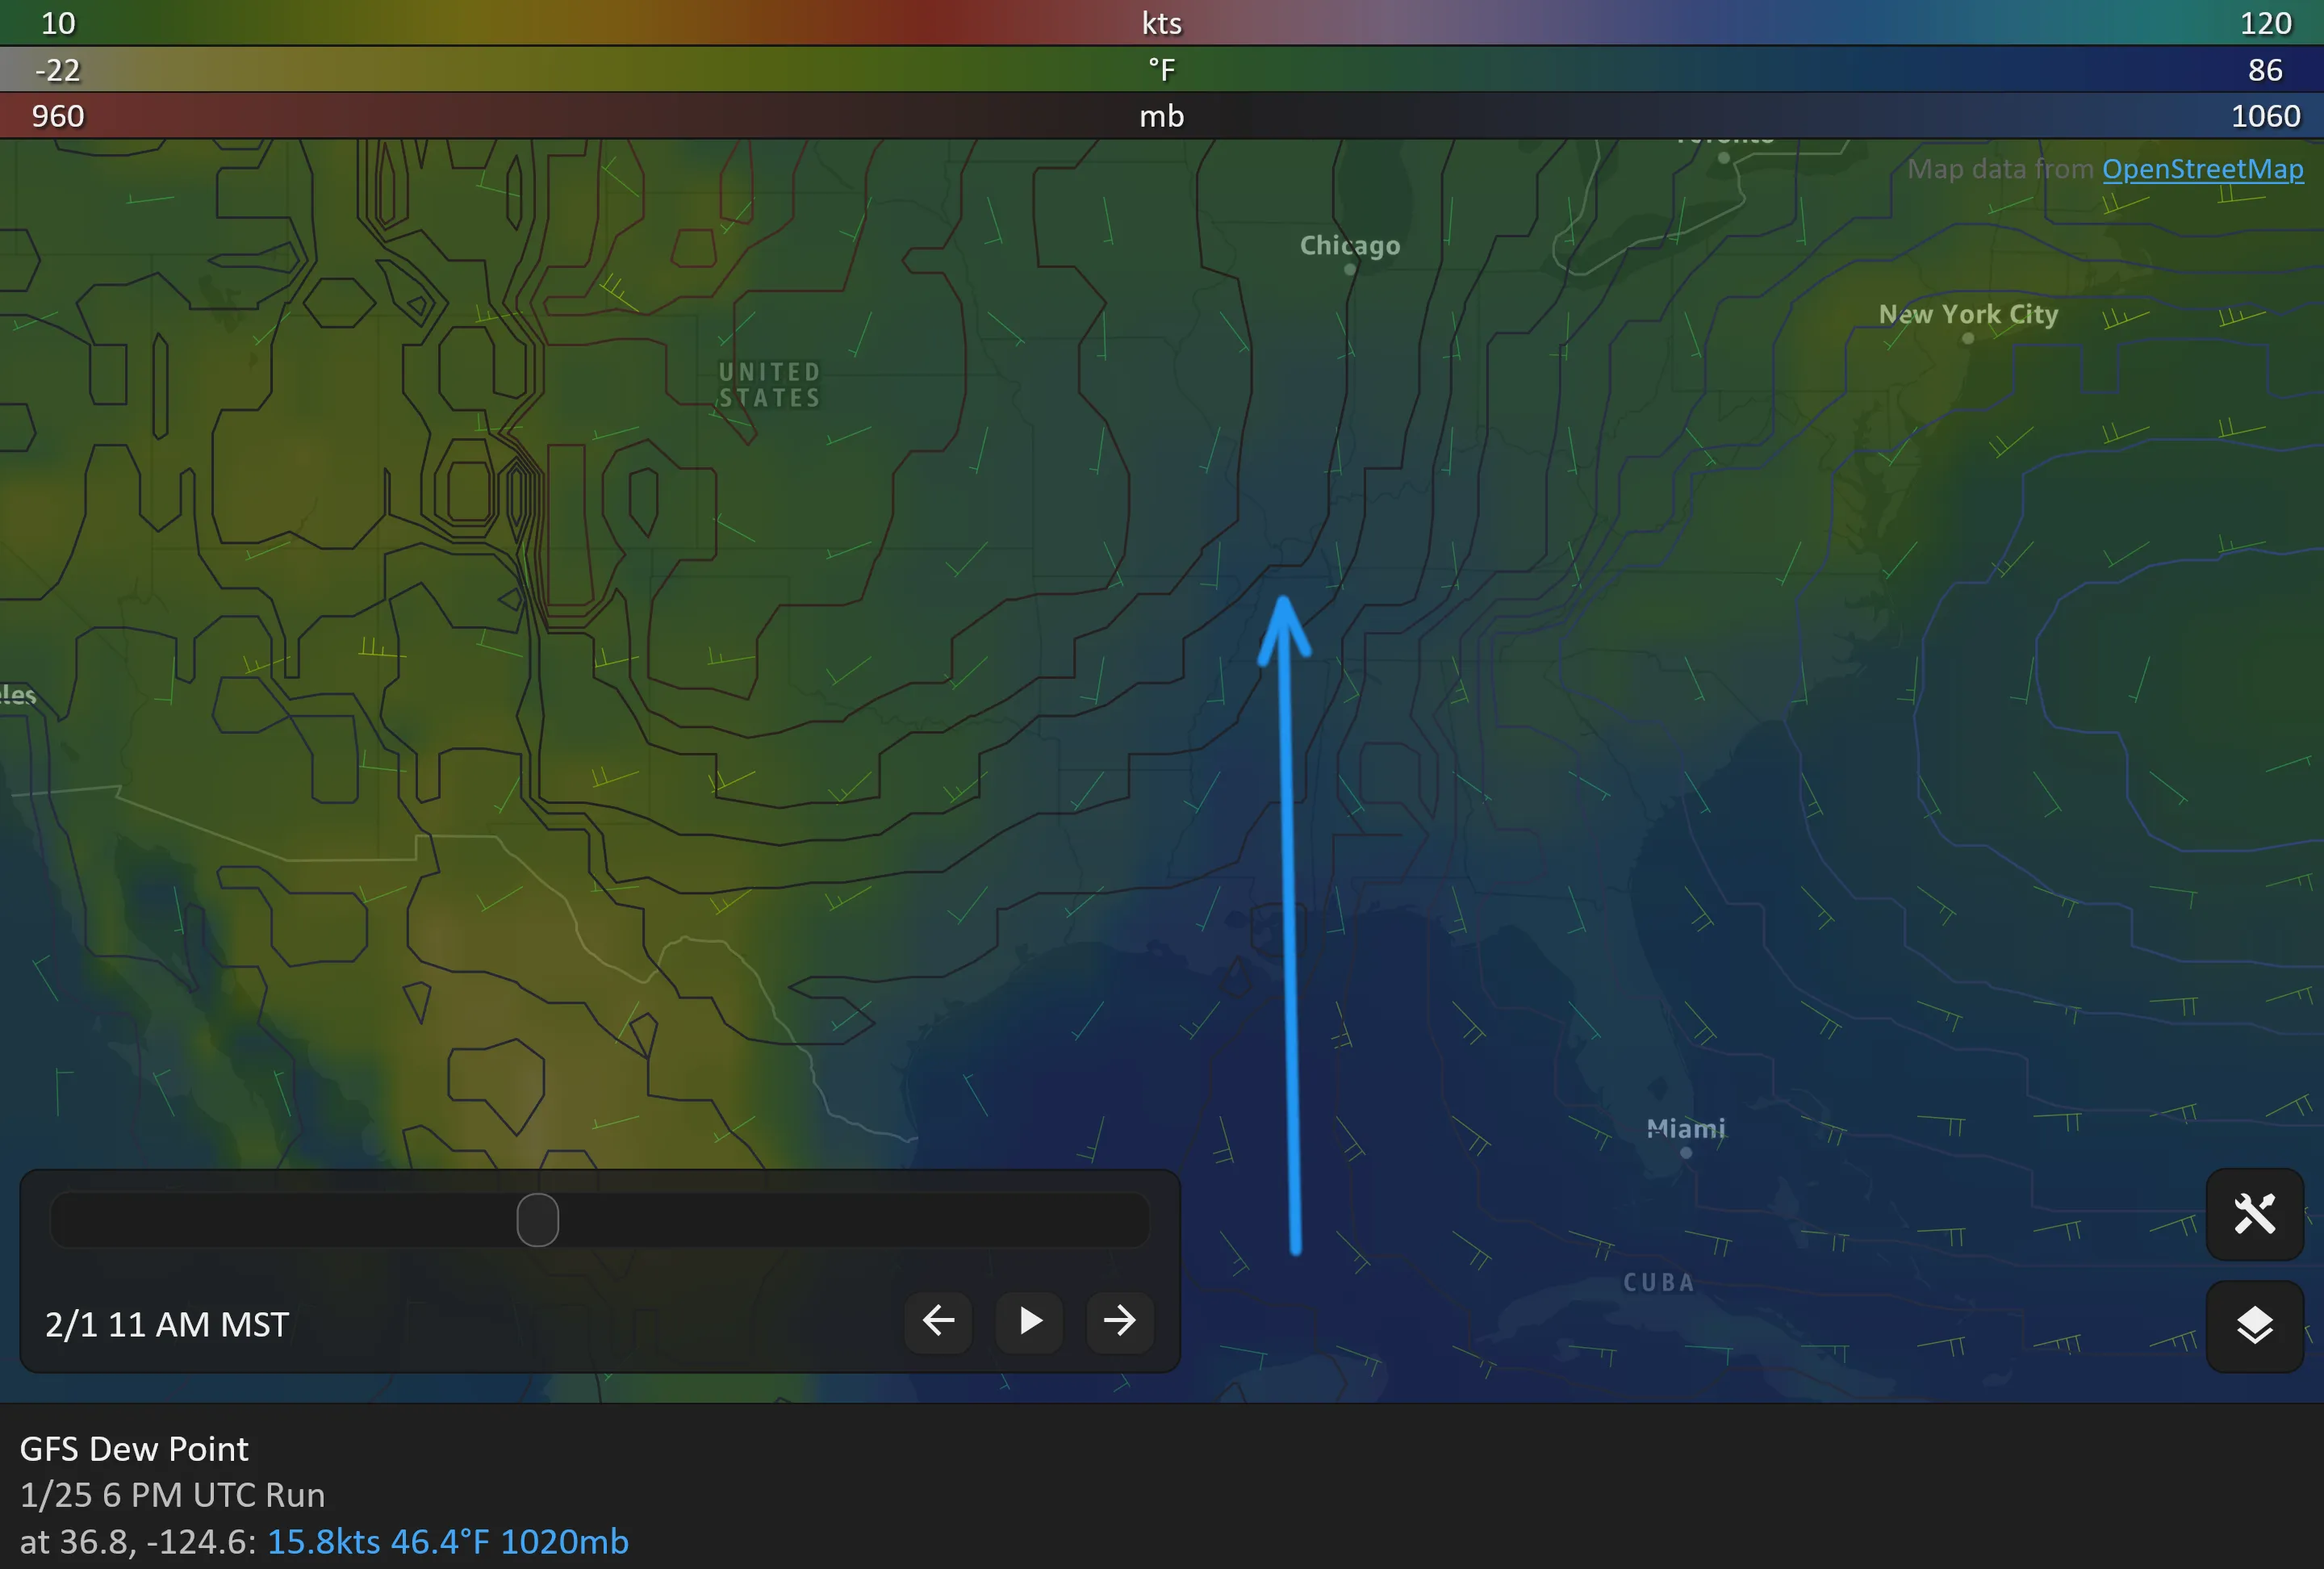
The relationship between mid/upper-level troughs, surface lows, and cyclogenesis is crucial for understanding severe weather formation. In North America, cyclogenesis in the right location can set up surface and low-level winds that allow for the development of a southerly "low-level jet"—a narrow band of fast-moving air. This jet brings moisture from the Gulf of Mexico northward into the Plains, where it combines with rising air due to the lifting associated with the trough. This influx of moisture, combined with the lift provided by diverging winds aloft, is a key ingredient for severe weather development, particularly thunderstorms, tornadoes, and other extreme weather events.
Moisture return can be seen on maps showing dew point or relative humidity:
Forecasting with 500mb Maps
500mb maps provide essential insight into weather patterns, especially when it comes to severe weather forecasting. By interpreting geopotential height, wind patterns, and trough structures, forecasters can gain a deeper understanding of large-scale atmospheric behavior. Recognizing the development of cyclogenesis and how it interacts with moisture return is crucial for predicting severe weather events. With hodo.graphics, you have the tools to visualize these patterns in detail, making it easier to track and analyze the factors that drive extreme weather.
Disclaimer
While we strive to provide accurate forecast data, we cannot guarantee the accuracy, completeness, or reliability of any information provided through our service. Data may be delayed, incorrect, or missing due to technical issues, source limitations, or other factors beyond our control. Users acknowledge that weather conditions can change rapidly and may differ from forecasted conditions. Our service is not a professional or official weather service and should not be used as such. For critical weather information, users should consult their national weather service or other authorized weather authorities. hodo.graphics is not intended to replace professional meteorological advice or official weather warnings.